UCSD Epigenomics Example Data Report 07102020
Zhang (Frank) Cheng (zhangc518@gmail.com), UCSD Center for Epigenomics
Wed Sep 9 14:49:23 2020
Sample information
| Sample Name | Label | Species | Experiment Type | Internal Library ID | Reference Genome |
|---|---|---|---|---|---|
| Panc1 cell lines | Cell.line.1_replicate.1 | human | ATAC-seq | JYH_999_1_2 | hg38 |
| Panc1 cell lines | Cell.line.1_replicate.2 | human | ATAC-seq | JYH_1000_1_2 | hg38 |
| GM19240[1] | Cell.line.2_replicate.1 | human | ATAC-seq | RMM_204_2 | hg38 |
| GM19240[1] | Cell.line.2_replicate.2 | human | ATAC-seq | RMM_205_2 | hg38 |
Sequencing metrics
View full MultiQC report (in new window)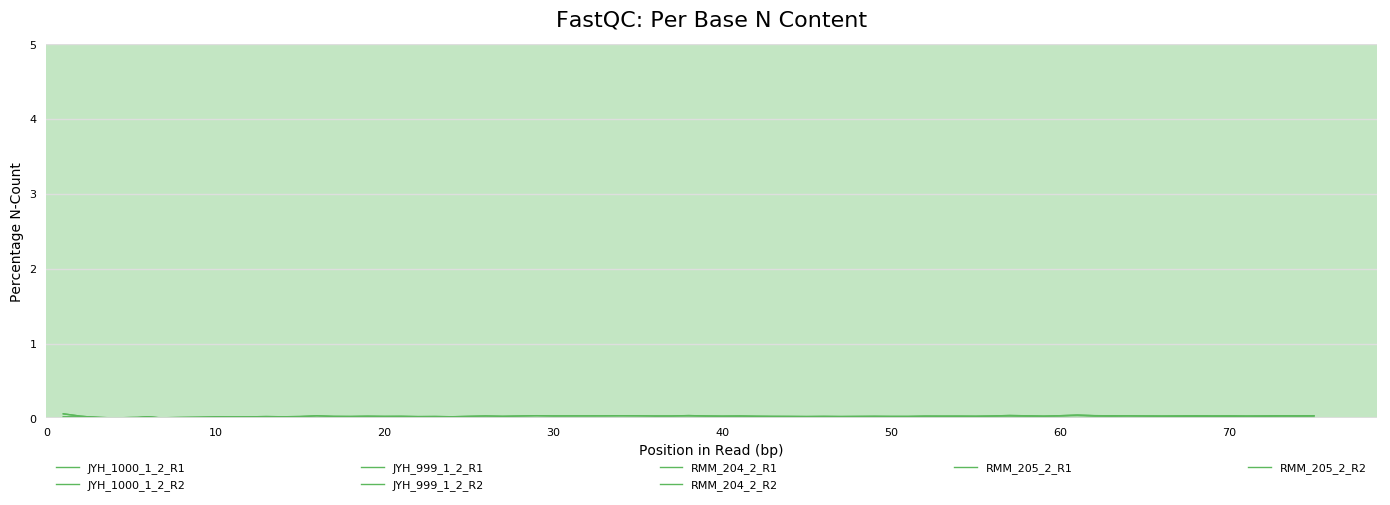
Alignment metrics
Alignment statistics (by count)
Alignment statistics (by %)
Mitochondrial read fraction
FastQ Screen
Fragment size distribution
ATAC-seq fragments show a characteristic multimodal size distribution reflecting sub-nucleosomal fragments (<100bp), mono-nucleosomal (~200bp), and sometimes multi-nucleosomal fragments at ~150bp intervals beyond that.
GC content after alignment
ATAC-seq alignments tend to have high GC content due to enrichment in promoters and other regulatory sequencing.
Signal-to-noise metrics
TSS enrichement (TSSe)
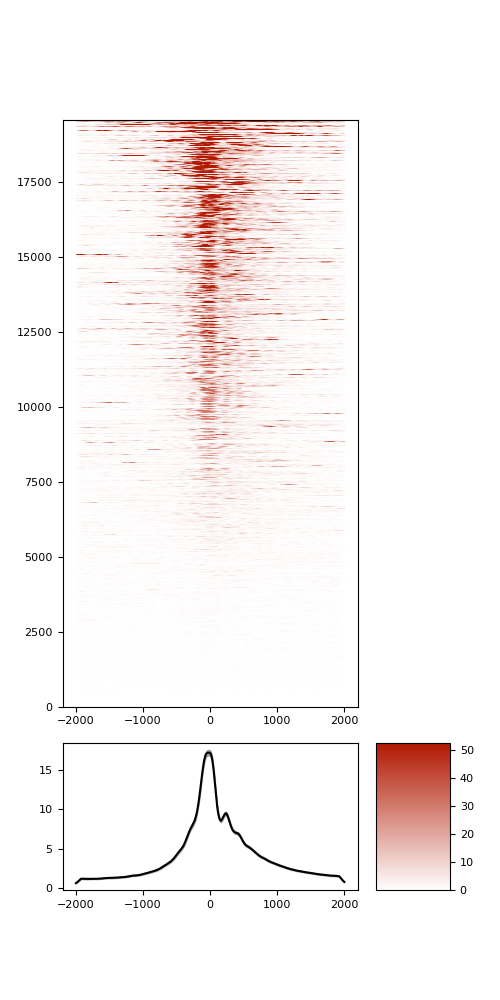

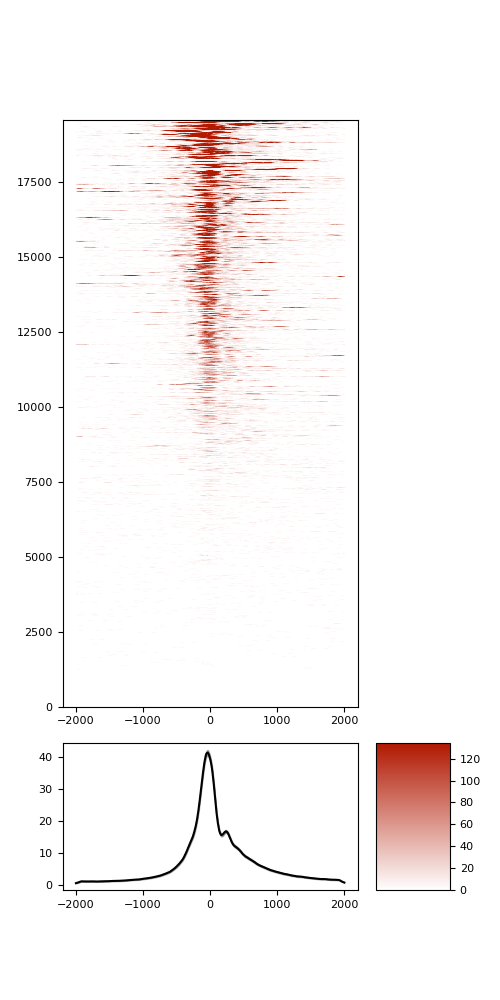
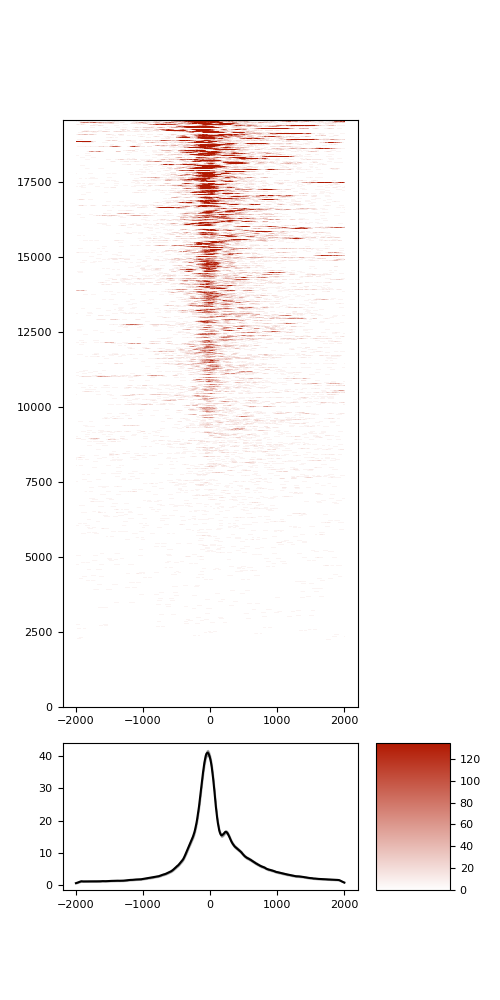
TSSe average profile
TSSe barplot
Fraction of Reads that Overlap TSS (FROT)
Peaks metrics
Peak counts
The number of peaks called per sample. Usually ~100K-200K.
Fraction of Reads in Peaks (FRiP)
A metric of signal-to-noise ratio. We generally prefer TSSe or FROT, because these metrics are independent of peak calls which vary between libraries.
PCA
Principal Component Analysis of samples based on peak intensity (fold enrichment of calculated background from MACS2).
Correlation matrix
Spearman's correlation matrix based on peak intensity (fold enrichment of calculated background from MACS2).
Genome browser
Download
Batch download
Click
Download file list
to download a
files.txt
that contains the list of urls to files in this report. Then run the script bellow on the terminal:
xargs -n 1 curl -0 -L < files.txt
Individual download links
Metadata table
This table contains a variety of QC metrics for each library. For more information about ATAC-seq QC metrics please see:
https://www.encodeproject.org/atac-seq/